How a Visual Sales Pipeline Gives You a Better Picture of Your Business

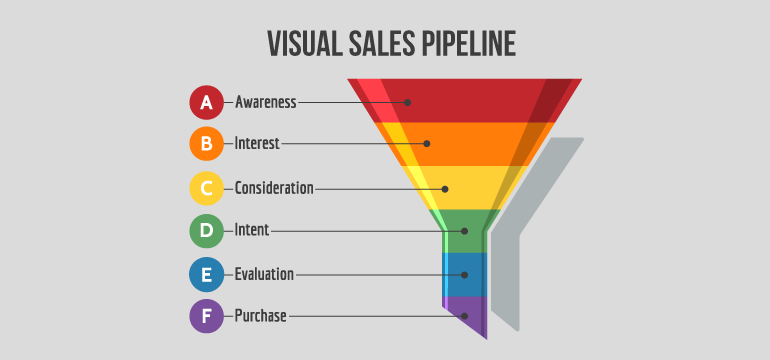
If you have been using CRM for a while, you might have noticed a sales pipeline tool integrated into it. Sales pipelines give you a visual representation of your sales prospects’ status, and where they currently stand in their buying journey. Visualizing data related to your prospects’ buying journey is very crucial to make accurate sales forecasts. It is also important to forecast deals that are going to close in a certain period.
While a visual sales pipeline provides such useful data, businesses often do not make use of them simply because they are not well-versed with the actual business benefits. In this article, let us take a look at how visual sales pipelines help you understand your business better.
1. Understand your Sales Process better:
Many businesses operate without understanding their sales process. Often, their sales strategy is limited to aggregating leads and trying to convert those leads into sales. While lead capturing and lead conversion are important sales processes, understanding where individual leads stand in their buying journey is crucial to sales success.
A visual sales pipeline graphically displays where leads stand in their journey so that sales communication can be customized for each set of leads at a particular juncture of their buying process. In other words, a graphic representation of buyers’ journeys helps businesses to understand their sales process better and make necessary changes to existing strategies.
2. Create an Effective Sales Strategy:
While understanding the buyer’s journey is important, it doesn’t solve the problem if the sales department does not create effective strategies. A graphic representation of the sales pipeline provides accurate data and insights which can be used to develop campaigns that convert better. Different stages of the sales cycle are pictorially displayed along with leads and prospects who might be in various stages of the buying cycle.
All this data helps to create sales strategies that work in the long term. It also becomes easier to track sales performance and assess key performance indices. Most importantly, businesses can make ad-hoc changes to their strategy depending on shifts in performance, which is usually missed if only numbers are observed. Observing numbers pictorially has a different effect on performance.

3. Understand where your leads are in the Sales Funnel:
A visual sales pipeline graphically classifies various leads and prospects under different stages of their buying journey. You can manually drag and drop them into different categories if you so wish, or you can automate this process as well. If your business is small, you can do this manually or get your sales professionals to do it for you.
This helps to enhance communication and increases the chances of converting dramatically. In addition, you can mark those leads that need analysis, and those that are malleable to a value proposition. This is particularly important when a lead is warm, and a value proposition will make them convert.
4. Close deals quickly, without spending much:
Research shows that closing deals are one of the most times-taking of all sales processes. However, it is also true that when you quicken the sales cycle and close deals quickly, you will witness explosive growth. A visual sales pipeline quickly helps you to identify decision-makers and create campaigns targeted at them. If data indicates that they will be open to a value proposition, you can quickly create a sense of urgency.
Visual data helps you to quickly make decisions, which directly helps reduce expenditure related to closing deals. Instead of wasting expensive man-hours on leads that are still not ready to convert, you can identify those that will, with the help of the visual sales pipeline.
5. Enhance Marketing Campaigns:
An efficient sales strategy always works in tandem with marketing. Unfortunately, many businesses do not integrate their sales and marketing teams, and there is usually a communication gap between the two. As a result, sales and marketing communication is often not in sync and do not fetch the results that one might expect.
Using a visual sales pipeline and sharing this with the marketing team can change the way the two teams communicate. Visual sales pipeline data helps create better marketing campaigns, which are more in tune with sales requirements. This helps fetch better ROI on marketing campaigns.

6. Visualizing Data helps you understand it better:
Many research studies show that pictorially represented data can be quickly processed and understood by people. Reams and reams of numbers and text will not have the same effect as representing the same graphically.
This is exactly what a visual sales pipeline does. It helps users to graphically understand complex sales data, and process that information quickly. This helps in arriving at better sales forecasts, planning sales and marketing campaigns quickly, and driving insights.
Use the Visual Sales Pipeline in your CRM:
Most businesses tend to overlook the importance of the visual sales pipeline. However, it comes with many benefits for the sales and marketing teams. Most importantly, the sales pipeline helps users to graphically view complex quantitative data. This helps in making better sales predictions and forecasts.
In addition, you will be able to understand exactly where your leads are, in their buying journey, which helps you to take better action. It also helps improve communication between sales and marketing teams and reduces expenditure associated with closing deals. All these reasons suggest that it is crucial to start using a visual sales pipeline if you haven’t already begun to do so. Wants to know more about exactllyCRM? Feel free to Contact Us and get a Free Demo.


